
The latest 48 hours of photon data
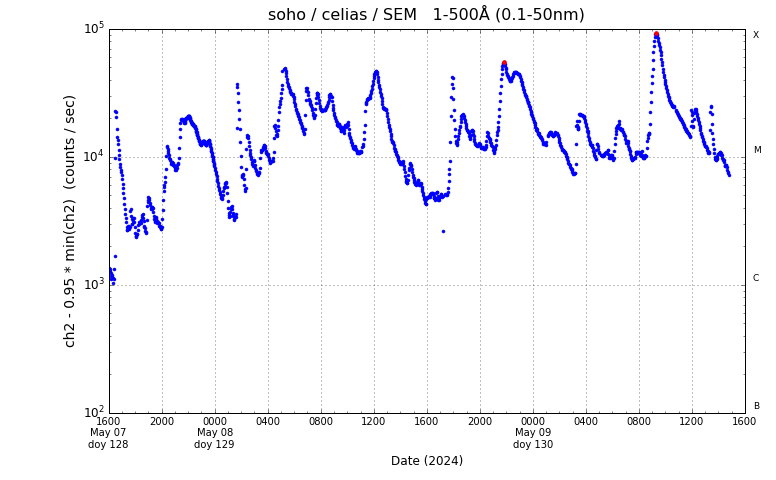
The first plot below reflects the full-disc solar flux in the passband 1 to 500 Angstroms (0.1 to 50 nm). The detector is much more efficient at the shorter wavelengths, effectively measuring the soft X-ray output of the sun. Two-minute averages are plotted for the last 48 hours. A quiet-time background of 95% of the minimum rate observed during that 48 hours is subtracted from the data set. Although this SEM channel has a passband larger than the 1 to 8 Angstrom range that is traditionally used to classify solar X-ray events, an approximate correspondence can be made. At a SEM value of 10**5 (above which saturation occurs), the equivalent X-ray class is typically within a factor of 2 of an X1 event; i.e., 10**5 ==> M5 to X2. Similarly, 10**4 ==> C5 to M2. This variable mapping is a product of different spectra in different X-ray events, and is explored here
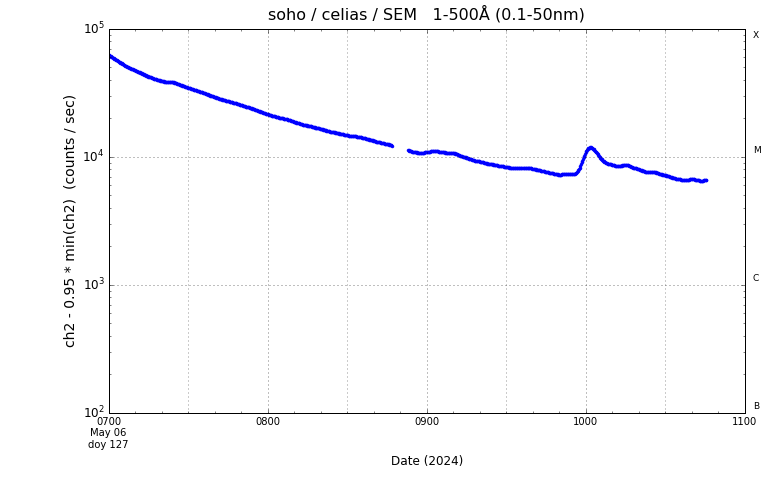
In the second plot is the same quantity, this time for the most recent 4 hours and using the maximum time resolution of 15 seconds.
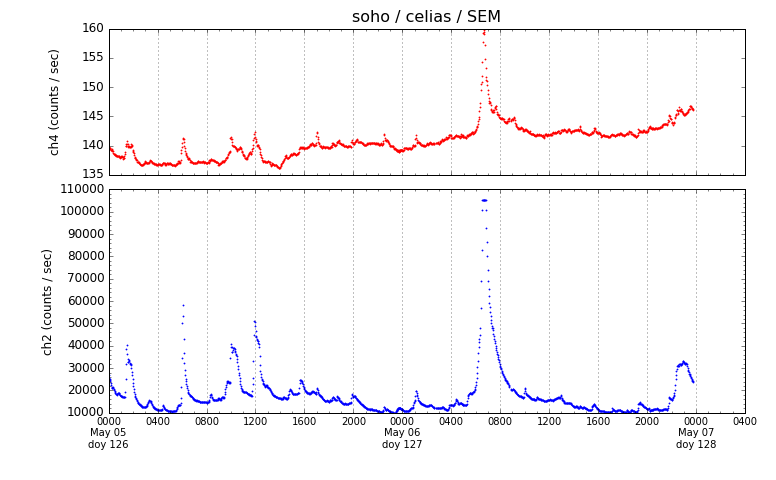
In the third plot, the bottom panel ("ch2") is again the 1 to 500 Angstrom SEM channel, but without any background subtraction. The top panel ("ch4") is the first-order SEM channel with a passband of 304 +- 40 Angstroms. This channel responds primarily to the very strong Helium 304 line, but is also sensitive to some 'hotter' lines (i.e., lines enhanced during solar events) in its passband, and can also be sensitive to background produced by energetic flare particles. For a rough indicator of the current flare background, see our PM flare plot. Other near-real time flare monitors are available from ACE/SIS and Soho/ERNE.
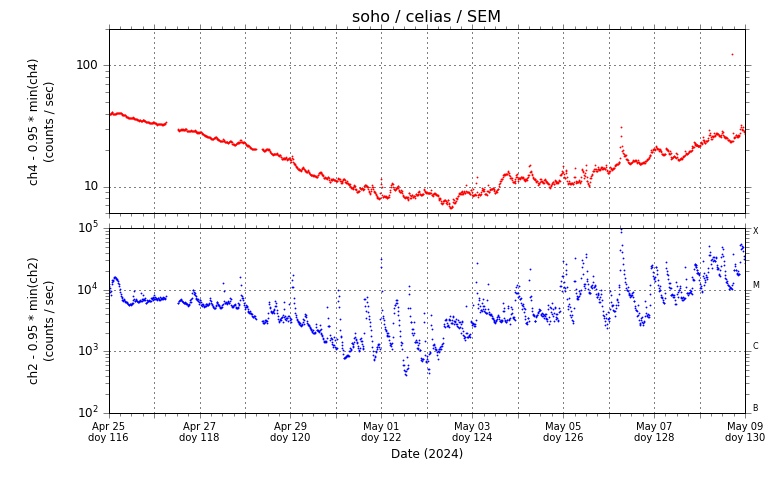
selected SEM figures during some interesting time periods


Comments
Post a Comment
please follow, like and comment