
FIREBALLS AND NEAR EARTH ASTERIODS AND COSMIC WAVES IN THE ATMOSPHERE
FIREBALLS
On Apr 02, 2022, the network reported 8 fireballs.
(8 sporadics)
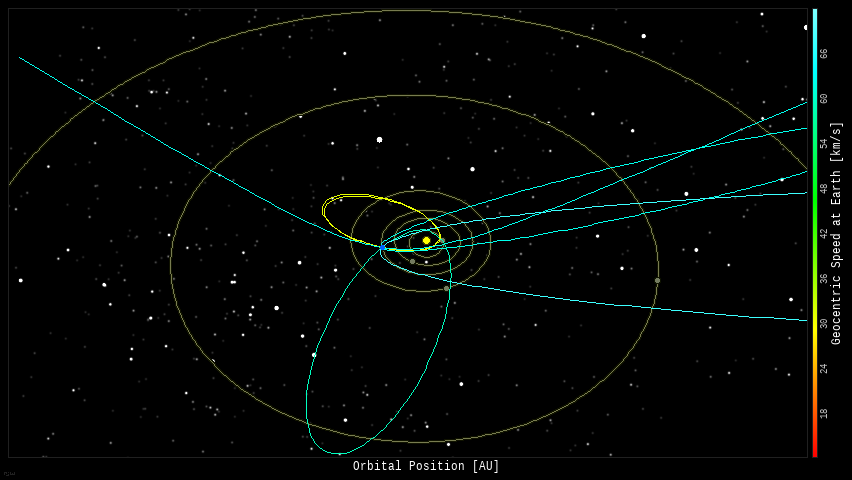
In this diagram of the inner solar system, all of the fireball orbits intersect at a single point--Earth. The orbits are color-coded by velocity, from slow (red) to fast (blue). [Larger image] [movies]
| Near Earth Asteroids |
| Asteroid | Date(UT) |
Miss Distance |
Velocity (km/s) |
Diameter (m) |
| 2022 FF1 | 2022-Mar-29 |
3.9 LD |
6.7 |
5 |
| 2022 FR1 | 2022-Mar-29 |
4.9 LD |
9.6 |
9 |
| 2022 GJ | 2022-Mar-29 |
19.3 LD |
20.9 |
62 |
| 2022 EL5 | 2022-Mar-29 |
7.1 LD |
3 |
14 |
| 2010 GD35 | 2022-Mar-29 |
17.7 LD |
12.5 |
43 |
| 2022 GA | 2022-Mar-30 |
1.7 LD |
10.5 |
15 |
| 2022 FL4 | 2022-Mar-30 |
2 LD |
10.7 |
17 |
| 2022 EK1 | 2022-Mar-30 |
19 LD |
7.6 |
42 |
| 2022 GB | 2022-Mar-30 |
0.7 LD |
8.2 |
5 |
| 2022 FX1 | 2022-Mar-30 |
13.3 LD |
9.6 |
25 |
| 2022 FM2 | 2022-Mar-31 |
11.6 LD |
6.2 |
20 |
| 2022 FL1 | 2022-Mar-31 |
5 LD |
2.6 |
5 |
| 2020 FW5 | 2022-Mar-31 |
12 LD |
12.9 |
27 |
| 2022 FQ2 | 2022-Mar-31 |
6 LD |
9.4 |
16 |
| 2022 GL | 2022-Mar-31 |
1.2 LD |
7.2 |
5 |
| 2022 GM | 2022-Mar-31 |
3.6 LD |
7.8 |
8 |
| 2022 DX4 | 2022-Mar-31 |
16.7 LD |
6 |
39 |
| 2022 GK | 2022-Apr-01 |
2.1 LD |
12.7 |
12 |
| 2022 GD | 2022-Apr-01 |
11.9 LD |
10.1 |
24 |
| 2022 GC | 2022-Apr-01 |
0.1 LD |
15.6 |
5 |
| 2022 FF3 | 2022-Apr-01 |
2.6 LD |
5.3 |
10 |
| 2022 GQ | 2022-Apr-01 |
0.1 LD |
7 |
3 |
| 2007 FF1 | 2022-Apr-01 |
19.4 LD |
12.8 |
155 |
| 2022 GS | 2022-Apr-02 |
16.2 LD |
5.3 |
26 |
| 2022 FQ | 2022-Apr-02 |
8 LD |
10.4 |
36 |
| 2021 GN1 | 2022-Apr-02 |
14.4 LD |
14.3 |
19 |
| 2016 GW221 | 2022-Apr-02 |
9.8 LD |
5.9 |
41 |
| 2022 FE2 | 2022-Apr-02 |
10 LD |
10.6 |
31 |
| 2022 FJ1 | 2022-Apr-02 |
16.5 LD |
5 |
27 |
| 2022 FL | 2022-Apr-03 |
8.7 LD |
7.3 |
21 |
| 2017 WN13 | 2022-Apr-04 |
6.3 LD |
19.5 |
102 |
| 2022 EN2 | 2022-Apr-04 |
18.7 LD |
5.6 |
37 |
| 2022 FG3 | 2022-Apr-04 |
12.6 LD |
7.4 |
24 |
| 2022 GH | 2022-Apr-04 |
6.9 LD |
10.6 |
39 |
| 2022 FO3 | 2022-Apr-04 |
6.7 LD |
11.3 |
22 |
| 2012 TV | 2022-Apr-05 |
19.2 LD |
18.1 |
32 |
| 2022 GO | 2022-Apr-07 |
15 LD |
9.6 |
25 |
| 2022 GP | 2022-Apr-08 |
2.3 LD |
17.6 |
19 |
| 2022 GX | 2022-Apr-08 |
3.7 LD |
12.9 |
14 |
| 2022 GT | 2022-Apr-09 |
12.4 LD |
4.9 |
16 |
| 2020 GH1 | 2022-Apr-09 |
16.8 LD |
7.2 |
28 |
| 2022 FU4 | 2022-Apr-09 |
8.3 LD |
4.7 |
13 |
| 2022 FT3 | 2022-Apr-10 |
19.8 LD |
11 |
22 |
| 2017 TO2 | 2022-Apr-10 |
17.9 LD |
11.6 |
78 |
| 363599 | 2022-Apr-12 |
19.3 LD |
24.5 |
221 |
| 2022 FR3 | 2022-Apr-14 |
18.3 LD |
8.4 |
90 |
| 2020 TQ6 | 2022-Apr-18 |
13.4 LD |
15.4 |
43 |
| 2022 FN3 | 2022-Apr-19 |
15.2 LD |
6.3 |
39 |
| 2017 UR2 | 2022-Apr-22 |
19.4 LD |
9.3 |
10 |
| 2020 VN1 | 2022-Apr-25 |
19.3 LD |
2.3 |
9 |
| 418135 | 2022-Apr-28 |
8.5 LD |
10.4 |
443 |
| 2017 XO2 | 2022-May-01 |
18.8 LD |
12.4 |
118 |
| 2017 HG1 | 2022-May-04 |
18.2 LD |
6 |
11 |
| 467460 | 2022-May-09 |
14.9 LD |
11.3 |
513 |
| 2019 JE | 2022-May-11 |
4.9 LD |
7.2 |
20 |
| 2012 UX68 | 2022-May-15 |
2.8 LD |
8.2 |
54 |
| 388945 | 2022-May-15 |
15 LD |
8.2 |
287 |
| 2013 UX | 2022-May-17 |
16.8 LD |
16.3 |
141 |
| 2021 WY | 2022-May-18 |
16.9 LD |
9 |
65 |
| 7335 | 2022-May-27 |
10.5 LD |
13.1 |
1108 |
| 2021 KO2 | 2022-May-30 |
3.1 LD |
14.8 |
9 |
| 2020 DA4 | 2022-Jun-01 |
5.5 LD |
8.9 |
26 |
| Cosmic Rays in the Atmosphere |
SPACE WEATHER BALLOON DATA: Almost once a week, Spaceweather.com and the students of Earth to Sky Calculus fly space weather balloons to the stratosphere over California. These balloons are equipped with sensors that detect secondary cosmic rays, a form of radiation from space that can penetrate all the way down to Earth's surface. Our monitoring program has been underway without interruption for 7 years, resulting in a unique dataset of in situ atmospheric measurements.
Latest results (Nov. 2021): Our balloons have just measured a sudden drop in atmospheric radiation. It happened during the strong geomagnetic storms of Nov. 3-4, 2021. Here are the data:
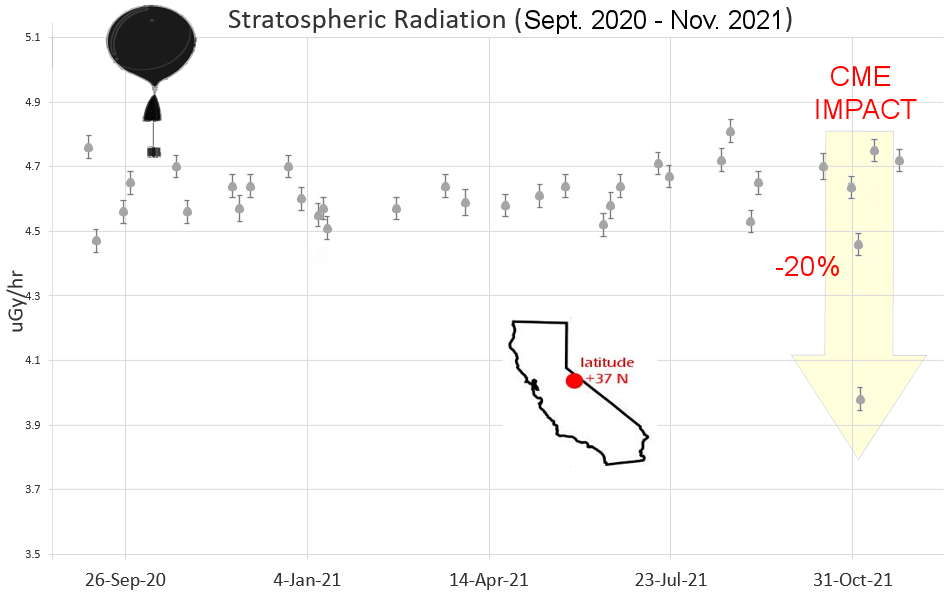
This is called a "Forbush decrease," named after American physicist Scott Forbush who studied cosmic rays in the early 20th century. It happens when a CME from the sun sweeps past Earth and literally pushes cosmic rays away from our planet. Radiation from deep space that would normally pepper Earth's upper atmosphere is briefly wiped out.
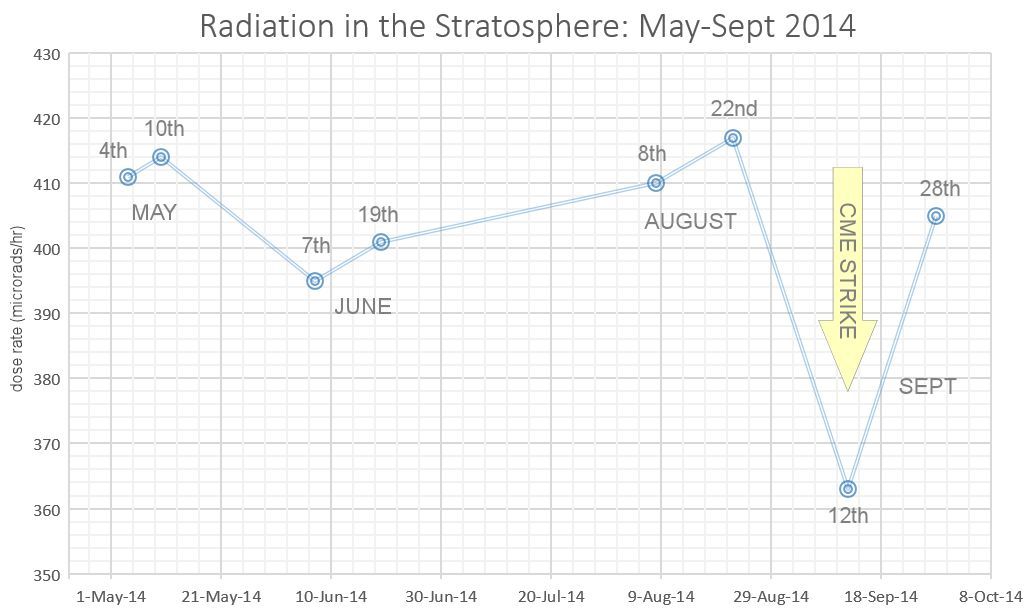
We have measured Forbush decreases before. For example, here's one from Sept. 2014. The Forbush Decrease of Nov. 3-4, 2021, was the deepest in the history of our 7-year atmospheric monitoring program. Radiation levels in the stratosphere over California dropped nearly 20%, more than doubling the previous record from our dataset.
En route to the stratosphere, our sensors also pass through aviation altitudes, so we can sample radiation where planes fly. This plot shows how the Forbush decrease was restricted to the stratosphere; it did not affect lower levels of the atmosphere:
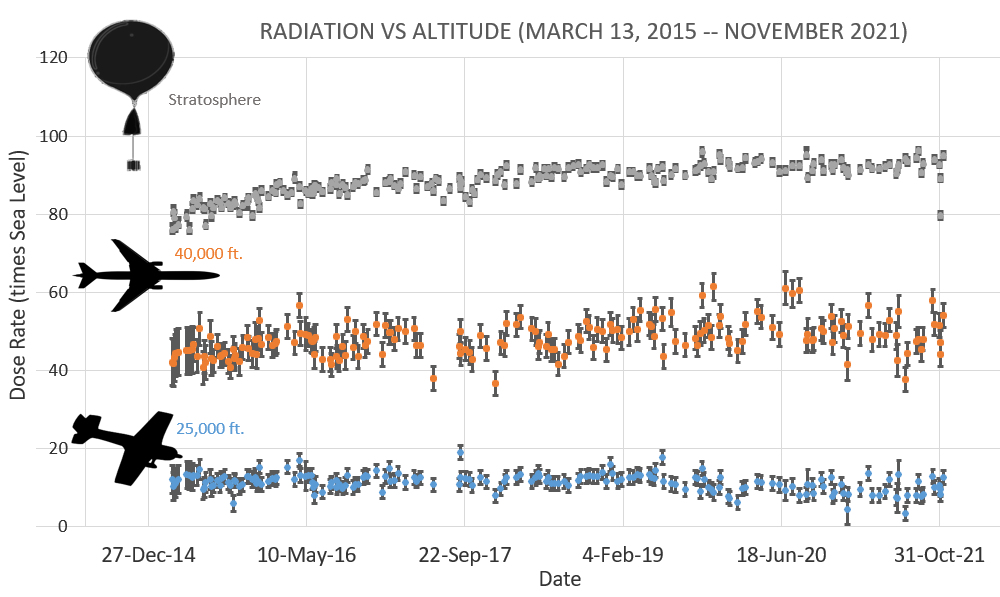
The dose rates shown above are expressed as multiples of sea level. For instance, we see that boarding a plane that flies at 25,000 feet exposes passengers to dose rates ~10x higher than sea level. At 40,000 feet, the multiplier is closer to 50x. The higher you fly, the more radiation you will absorb.
.Who cares? Cosmic rays are a surprisingly "down to Earth" form of space weather. They can seed clouds, trigger lightning, and penetrate commercial airplanes. According to a study from the Harvard T.H. Chan school of public health, crews of aircraft have higher rates of cancer than the general population. The researchers listed cosmic rays, irregular sleep habits, and chemical contaminants as leading risk factors. Somewhat more controversial studies (#1, #2, #3, #4) link cosmic rays with cardiac arrhythmias and sudden cardiac death.
.Technical notes: The radiation sensors onboard our helium balloons detect X-rays and gamma-rays in the energy range 10 keV to 20 MeV. These energies span the range of medical X-ray machines and airport security scanners.
Data points in the first graph ("Stratospheric Radiation") correspond to the peak of the Regener-Pfotzer maximum, which lies about 67,000 feet above central California. When cosmic rays crash into Earth's atmosphere, they produce a spray of secondary particles that is most intense at the entrance to the stratosphere. Physicists Eric Regener and Georg Pfotzer discovered the maximum using balloons in the 1930s and it is what we are measuring today.
| All Sky Fireball Network |


Comments
Post a Comment
please follow, like and comment